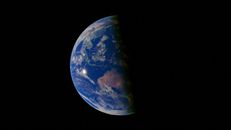
The tropical Pacific is developing an unusually powerful El Niño. The harder question is what that signal will mean for the United States.
In its October 8 assessment, the National Oceanic and Atmospheric Administration’s Climate Prediction Center said El Niño was continuing to strengthen and assigned an 83 percent chance that the October–December 2026 period would meet its threshold for a historic event—one exceeding the strength of previous El Niños since 1950 under the agency’s Relative Oceanic Niño Index.
That is a substantial forecast. It is not, however, a national weather forecast written months in advance.
The distinction matters because El Niño is often described as though warm water in the Pacific produces a fixed sequence of weather across the country. The actual process is less direct. A major El Niño changes tropical convection, atmospheric pressure and the Walker circulation. Those changes can influence the jet stream and storm tracks thousands of miles away. But the resulting effects depend on the event’s precise structure, its interactions with other ocean basins and the atmospheric conditions that happen to be present when individual storms develop.
What NOAA knows
NOAA’s assessment rests on more than sea-surface temperature. The agency reported persistent enhanced convection and rainfall across the central and eastern tropical Pacific, suppressed convection over Indonesia, significantly negative Southern Oscillation indices and ocean conditions consistent with a strengthening El Niño. The combination is important: El Niño is a coupled ocean-atmosphere phenomenon, not simply a patch of unusually warm water.
NOAA reported that sea-surface temperature anomalies exceeded 4 degrees Celsius in portions of the eastern equatorial Pacific during September. The Niño-3.4 index reached 2.1 degrees Celsius, while the Niño-3 and Niño-1+2 regions were warmer still. Those measurements describe a powerful tropical-Pacific event. They do not, by themselves, determine how much rain will fall in California, whether a particular storm will reach the Gulf Coast or how much snow a city will receive.
The agency’s forecast synthesizes observations with multiple ocean-atmosphere models. NOAA’s official ENSO strength outlook notes that stronger El Niño events generally increase confidence in expected impacts, but never guarantee them.
What “historic” means
The word “historic” requires care. In this case, NOAA is using a defined statistical threshold: a three-month Relative Oceanic Niño Index value of at least 2.5 degrees Celsius, compared with events in the record beginning in 1950. The forecast gives the October–December period an 83 percent chance of reaching that threshold.
That is not the same as saying the coming winter will produce the most destructive floods, the most rain in California or the most unusual weather in every region. A record or near-record ocean anomaly can produce familiar teleconnections without reproducing the exact consequences of an earlier event.
The comparisons most likely to appear are the major El Niños of 1982–83, 1997–98 and 2015–16. They are useful historical reference points, but not interchangeable templates. The 2015–16 event was among the strongest in the modern instrumental record, yet its North American effects did not reproduce every feature of the earlier strong events.
That is one reason researchers distinguish between the strength of an El Niño and its spatial pattern. Events with warmer water concentrated farther east in the Pacific can generate different atmospheric responses from events with a more central-Pacific structure. Researchers continue to debate whether those categories represent distinct modes or points along a continuum, but the practical conclusion is straightforward: two events with similar index values need not produce identical U.S. winters.
The United States receives probabilities, not promises
El Niño winters often favor a more active southern storm track. The resulting pattern can increase precipitation across parts of the southern tier, the Southwest and California, while reducing precipitation or snowfall across portions of the interior Northwest, the northern Rockies and the Great Lakes.
The NOAA explanation of El Niño and North American snowfall emphasizes why precipitation and snowfall must be separated. A storm track can deliver more moisture to a region without producing more snow if temperatures are too warm. Elevation, storm timing and local conditions remain decisive.
NOAA’s current seasonal outlook favors wetter-than-normal conditions across much of the southern and central United States, with the wet signal extending toward the Atlantic coast. It also identifies weaker odds for below-normal precipitation in parts of the interior Northwest and Great Lakes region. Those are seasonal probabilities, not guarantees for individual states or communities.
A winter can be wetter than average while containing several dry weeks. A region favored for increased snowfall can experience rain, warmth or a long storm-free interval. Seasonal averages describe changed odds across many possible weather sequences; they do not specify the sequence that any one community will experience.
Why the signal weakens as it travels
The remote effects of El Niño are called teleconnections. They are real, well studied and physically meaningful, but they are not mechanical conveyor belts.
A review in Reviews of Geophysics describes ENSO teleconnections as nonlinear and sensitive to the location and amplitude of Pacific temperature anomalies, as well as to conditions outside the tropics. The North Atlantic, Indian Ocean, Arctic circulation, snow cover, soil moisture and stratosphere can all alter the eventual pattern.
Research using paleoclimate data also finds that North American effects have varied across centuries. A study in Paleoceanography and Paleoclimatology concluded that diverse El Niño events and natural atmospheric variability make the teleconnections less consistent than a short instrumental record might suggest.
Climate change adds another complication. A warmer atmosphere can hold more moisture, and recent research indicates that human-driven warming may already be changing some climate teleconnections. But the regional consequences remain uncertain. It would be an error to attribute the development of this individual El Niño to climate change, just as it would be an error to assume that a warming climate leaves the event’s effects unchanged.
What decision-makers should do
The uncertainty is not a reason to ignore the forecast. It is a reason to use it correctly.
Water managers can review reservoir and allocation plans. Agricultural officials can test assumptions about winter moisture and planting conditions. Utilities can examine energy-demand scenarios. Emergency planners can update flood, landslide and storm-readiness procedures. Communities facing drought or depleted reservoirs can treat a wetter seasonal outlook as a planning opportunity without assuming that relief is guaranteed.
The appropriate response is contingency planning, not panic. A seasonal forecast is valuable precisely because decisions can be adjusted as observations accumulate. NOAA’s next ENSO diagnostic discussion is scheduled for November 12, and later updates will provide more information about the event’s peak strength, structure and persistence.
The central fact is already clear: a powerful El Niño is developing in the tropical Pacific. What remains unresolved is how completely that signal will be transmitted through a complicated atmosphere and into the weather experienced by particular American communities.
That gap between a reliable large-scale mechanism and an uncertain local result is not a failure of climate science. It is the reason probability, rather than certainty, is the proper language for the winter ahead.